Ageism in data
The Equality Insights (formerly the Individual Deprivation Measure) survey asks questions about 15 dimensions of life to every individual adult in a sampled household. The information collected sharpens the focus on how different people experience different aspects of deprivation and how this might vary depending on their individual characteristics, including their age.
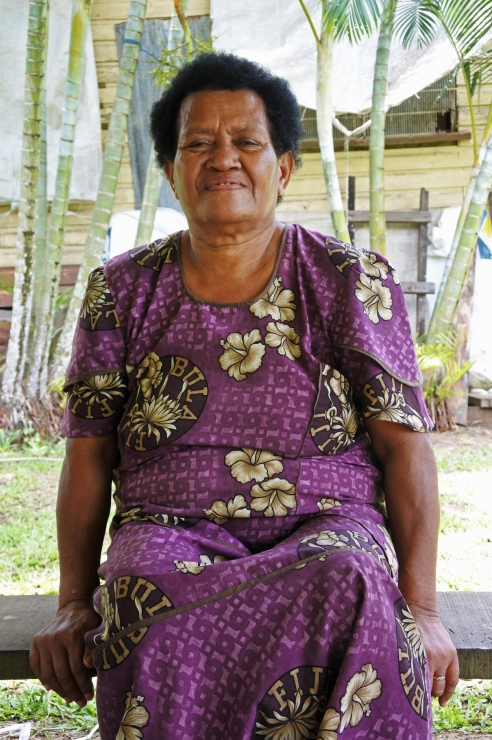
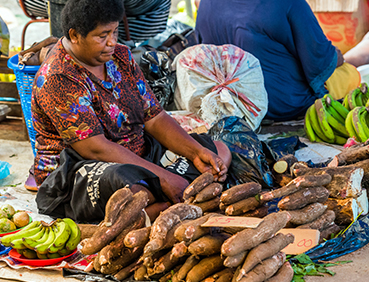
Fijian woman in her 70’s sit outside her home. Credit: Rafael Ben-Ari.
Capturing data that enables exploration of the intersection between age and gender is crucial to understanding the differences in men and women’s experiences at discrete moments in their life-cycle. Comparison of age cohorts also enables a clearer sense of how the impacts of poverty can intensify and lessen at different moments in an individuals’ life, for example, the intensifying effect of poverty for women during the years when child bearing and rearing overlap with expectations of economic and labour-force participation. Importantly, longitudinal data that gives visibility to age and gender moves beyond just moment-in-time snapshots so that the cumulative impact of deprivation across an individual’s life can be gauged.
Comparing between generations versus across an individual lifecycle
On the 14th of July 2020, our Research Fellow, Dr Kylie Fisk was on the panel of a High-Level Political Forum (HLPF) side-event titled Gender data for gender equality: New approaches to accelerate action. The session was chaired by Julie-Ann Guivarra, First Assistant Secretary ambassador for Gender Equality. During the Q&A part of the session, Julie-Ann posed the following question to Dr Fisk of IWDA:
“Relating to the need for gender data across a life course, from your experience, what are the benefits of having data that can provide insights into the intersection between gender and age? & how can we strengthen the availability of this data?”
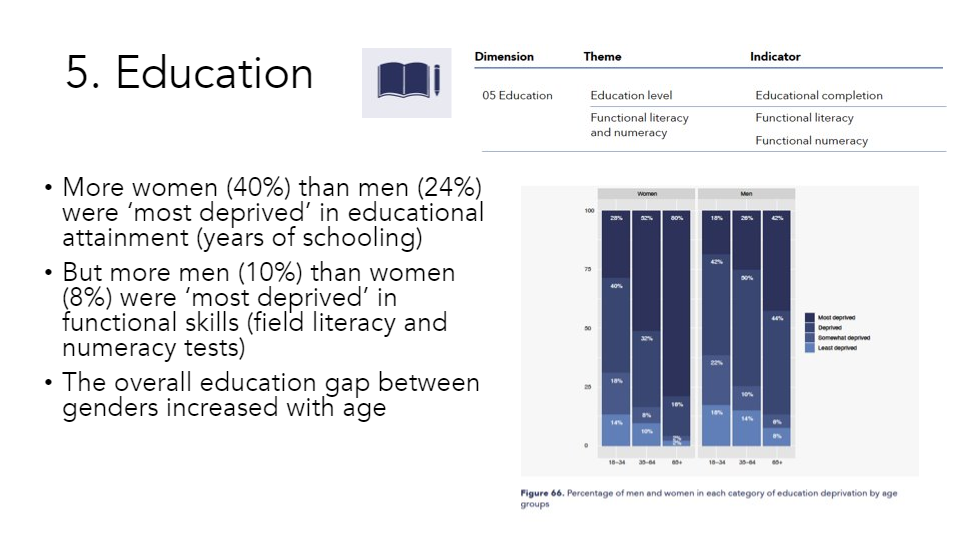
A slide from Dr Kylie Fisk’s HLPF side event presentation.
In the excerpted slide (above) on education deprivation, we can see how deprivation increases with age. “What we have to consider from a technical perspective,” Dr Fisk said in response during the Q&A, “Is that we are seeing cohort effects there, so cross-sectional data will tell you about different age cohorts but not the life cycle of women who are young now.”
This means that young women now may have different experiences of entering the education system, and therefore have different outcomes when they themselves are in an older age bracket. The intersection between age, gender and location may therefore change; the experience of older individuals is not fixed.
“To understand actually moving through the different life stages we really need regular, individual level data collection, disaggregated by gender and age, or we need longitudinal data to actually be tracking individuals, which requires a lot resource investment, but it’s worthwhile otherwise that information is just missing,” says Dr Fisk.
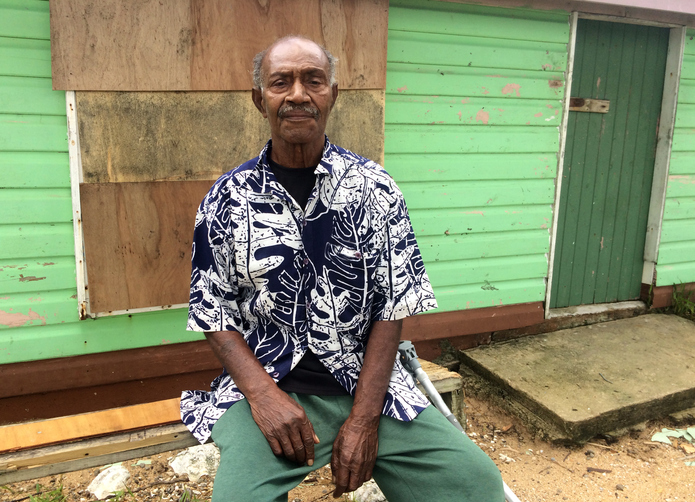
Elderly Fijian man in his 70’s sit outside his village home. Credit: Rafael Ben-Ari via iStock.
Ageism in data collection
To capture meaningful data about individuals in different age groups, and across their life cycle, Dr Fisk says that we need to end the practice of having upper age limits on eligibility for surveys.
“Often surveys, particularly poverty surveys, have the upper-age limit at about 65 and it’s to do with concerns about consent and ability to participate but to me that talks to not actually having an age limit but actually to improving our data practices,” she says.
“So if the concern is facilitating functional difficulties such as hearing and seeing for older adults, then we as data collectors need to be facilitating that rather than cutting off older people from participating in data collection.”
If elder groups are cut out, she says, this will create bias data. Similarly, ages are often grouped together. There is a general trend to take people 18-35, 35-65 and then 65+. “But the circumstances between an 85 year old woman and a 65 year old woman are really huge,” says Dr Fisk. “This is a little technical tweak that we can make in our data collection, analysis and dissemination to improve the availability of the data.”
Intra-household data also helps policymakers consider relational information. For example, an older woman who is a widow is going to be in a very different circumstance to an older married woman and we know poverty really increases with widows in the absence of socio-economic support structures.
“My experience is that when you show decision-makers ‘this is what’s happening with older women and younger women’ there is this natural instinct to want to know more and uncover more – what about older rural women? What about women with disabilities?,” says Dr Fisk.
“So we need to put the best practice out there and meet that natural inclination to see more so I think this is how we create and maintain interest in availability of data on the lives of women throughout the life cycle, which is important and highlighted in the current Coronavirus crisis.”
In a time when COVID-19 response sees governments calling for people to quarantine, increase hygiene practices like handwashing and protect general health while continuing to perform necessary work and livelihood activities, detailed data on access to water, sanitation and shelter are particularly pertinent. As are the Equality Insights dimensions on work, time-use, voice and health.
![]()
The 15 dimensions measured by Equality Insights
Increasing the availability of intersectional gender data, and ceasing ageist practices that add biases to that database, will help decision-makers tailor responses for improved health outcomes for all. To learn more about the Equality Insights survey and keep up to date with happenings in this space, subscribe to our newsletter and stay up to date.
Comments